Post #5 - Tables, Figures, and Charts
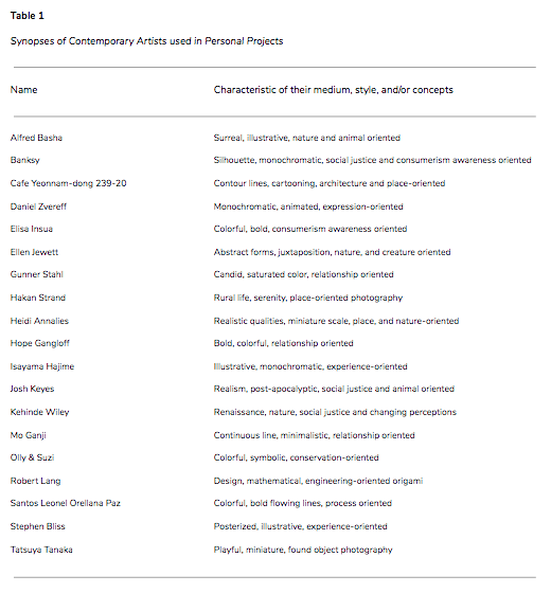
A table I want included in my final paper is a synopsis over the contemporary artists my students chose to use for their inspiration in their personal projects. Before choosing an artist students had information collected through visual journals, a photovoice unit, and teacher field notes that directed the teacher in connecting the students with an artist they would find inspiring. One on one discussions and email communication were then used by students and teacher to narrow down which artist they preferred. In Table 1 three of the nineteen artists listed were chosen by the student without teacher assistance, the majority of the others were the one artist chosen from three suggested by teacher.
I ran into a few issues while creating this table and know it still needs adjustments. I am unsure if the rules are correctly placed because of spacing but was unable to get the underline tool to work all the way across when there wasn’t font. I believe it to have the correct areas of bold and italic fonts placements. Another issue I ran into as I simplified information from my master list of students chosen artists was that I messed up in recording that one of my students changed their artist after they couldn’t find a good method of preserving leaves to paint on. However they wrote their proposal over that artist and did start the project with them in mind so should I still list them in the synopses? I am unsure. I also can't seem to find where I found the artist she did end up making her final project over, I think I found them from the Art of Education? The majority of students contemporary artist were found from the site Colossal, https://www.thisiscolossal.com/.
I ran into a few issues while creating this table and know it still needs adjustments. I am unsure if the rules are correctly placed because of spacing but was unable to get the underline tool to work all the way across when there wasn’t font. I believe it to have the correct areas of bold and italic fonts placements. Another issue I ran into as I simplified information from my master list of students chosen artists was that I messed up in recording that one of my students changed their artist after they couldn’t find a good method of preserving leaves to paint on. However they wrote their proposal over that artist and did start the project with them in mind so should I still list them in the synopses? I am unsure. I also can't seem to find where I found the artist she did end up making her final project over, I think I found them from the Art of Education? The majority of students contemporary artist were found from the site Colossal, https://www.thisiscolossal.com/.
Post #4 - Description of Work and Reflection
I am working to collect qualitative data on my students experience of this study to validate the essence. My main study question is investigating if allowing students control of guiding their planning, implementation, and assessment heightens their engagement. The qualitative data points I am collecting include:
This study is slowly falling into place and I do find a good portion of students work and reflections are on the positive side of things. However, I feel a big challenge that I have struggled with and students have commented on, is the pace at which the projects were given. I have already started to adapt the lesson plan I wrote to accompany the projects in the study to have better time focus. I hope that this adaption will align the projects more and keep us from having to juggle so many different projects at once. I do feel that this challenge has made me better at organization though. Another challenge is deciding how best to code my data. I have spent a good portion of time just analyzing and deciding how to code just to then figure out it has a flaw! I have found handwriting analysis and thinking with my study questions in mind and then working backwards has, so far, helped with coding the most.
- Coding students written Proposals for words that indicate excitement and goal orientation.
- Visual data from teacher observations of progression/on-task or stalled progression and data from students on their thoughts of their progression.
- Coded reflections from students on feelings of being self-motivated and verbally peer-motivated.
- Students intended plans with the work and if in the end the work was then taken with them.
- Photos of students finished work with instructors field notes
- Reflections on their finished projects
- Students pre and post survey answers on how they feel they align with Art Appreciation
- Coded students written statements that convey appreciation or thanks in their Proposals
- Coding of students multiple intelligence strengths
- Building upon knowledge of students in the study by photographic essays and visual journals to modify oncoming projects.
This study is slowly falling into place and I do find a good portion of students work and reflections are on the positive side of things. However, I feel a big challenge that I have struggled with and students have commented on, is the pace at which the projects were given. I have already started to adapt the lesson plan I wrote to accompany the projects in the study to have better time focus. I hope that this adaption will align the projects more and keep us from having to juggle so many different projects at once. I do feel that this challenge has made me better at organization though. Another challenge is deciding how best to code my data. I have spent a good portion of time just analyzing and deciding how to code just to then figure out it has a flaw! I have found handwriting analysis and thinking with my study questions in mind and then working backwards has, so far, helped with coding the most.
Post #3 - Validity and Triangulation
Validity or to validate, to me, is to have proof of your statement, fact, or belief. Less than a month ago I was walking a batch of fifth graders back to class and one of the male students made a comment to me and I asked if they could validate that statement. I was surprised that this student did not know the word and asked the rest of the class if anyone had a definition for it, no one. I spent time giving my own definition and also giving a few examples. This experience validated to me that my fifth grades did not know the definition of validity. But this event stuck with me because I wondered how much of my vocabulary I use and just assume students know. Also, made me consider if I am switching my language well enough from when I go through the afternoon switch of High School to Elementary.
It is essential that I make sure my research is credible through validation because I wish to formulate a study that will be useful to others and if I am only providing what went well in my research then I would be missing an essential half to my study. I believe that it is through challenges that individuals find the most growth and if I am not giving proof, validation, of the challenges and difficulties then my study is just a bunch of fluff and doesn’t paint a realistic experience for my readers.
Triangulation, originally, to me was a math term, now after the readings I see it as a way that researchers use to check and validate their work. It’s having multiple data types that are analyzing a research question. Triangulation can be used to strengthen a finding or to show disparities and inconsistencies.
I currently have a small portion of my students finishing their Contemporary Personal Projects. I then need students to give artist statements about their work and take the finishing survey. In my Data Analysis folder my themes each have more than one data point type, plus the addition of field notes, this should allow for triangulation of my research questions. However, even with my data that I have collected I feel the strongest validation I have is actually from my research participates. Throughout this process I have had one on one discussions with them about the findings in their written portions of the data to investigate their choices, ideas, and preferences. A specific example of an idea I have to strengthen my studies findings on the theme of artist connections is to code students photographic essays and proposals and check for overlapping of ideas, concepts, and preferences to see if the alignment of these then boosted the motivational output from my students or if these did not affect motivation.
Post #2 - Article Diagram, Study Diagram, and Reflection
This Mind-Mapping activity made me feel reminiscent of the Field Notes Activity from our previous ArtEd, 6299. I fine combed through chapter 5, Phenomenology Study in the Creswell text. I was glad that I sketched out the flow of ideas on a piece of paper. Especially when I realized that the reading did not truly “start” at the beginning of the study but provided an overview first. I also struggled because in the beginning I bubbled almost each sentence before really clumping and deciding the most important aspects. I then used my sketched out idea flow-chart to create my Mind-Map on Canva.com. I’ve had previous experience with Canva but this assignment forced me to learn and apply different features to my project. I also enjoyed coming up with themes for my Mind-Maps and searching for the free graphics that would correlate with my design. (On a personal note I am extremely grateful to get more practice with Canva as I hope to create a infographic wedding program later in the year.) In the design for my personal study I find it funny that my arrows look similar to Star Wars battle cruisers as they fly to planets and huge stars. Overall, this assignment gave me time to really consider how the portions of my paper will be laid out and in what sequence, which gives me peace of mind in the upcoming formating of my paper.
This week on the topic of my study I continued to collect data from students as a good amount of them finished their VoiceThreads for the Mixed Media project. I also started photographing their second visual journal and have around half of my students working on their personal project. I have a clump of students who have finished their projects and another clump that have to get connected with a contemporary art inspiration. I dived deep into some of my students proposal papers for their personal projects with contemporary connections and was awestruck by several of them and the goals/reflective thought process they displayed in their writing. I can’t believe my research will be coming to and end soon. I have never in my six years of teaching known my students as well as I know this class and even when my study is at an end, I can only currently see this as a positive!
This week on the topic of my study I continued to collect data from students as a good amount of them finished their VoiceThreads for the Mixed Media project. I also started photographing their second visual journal and have around half of my students working on their personal project. I have a clump of students who have finished their projects and another clump that have to get connected with a contemporary art inspiration. I dived deep into some of my students proposal papers for their personal projects with contemporary connections and was awestruck by several of them and the goals/reflective thought process they displayed in their writing. I can’t believe my research will be coming to and end soon. I have never in my six years of teaching known my students as well as I know this class and even when my study is at an end, I can only currently see this as a positive!
Creswell, 2002, Chapter 5
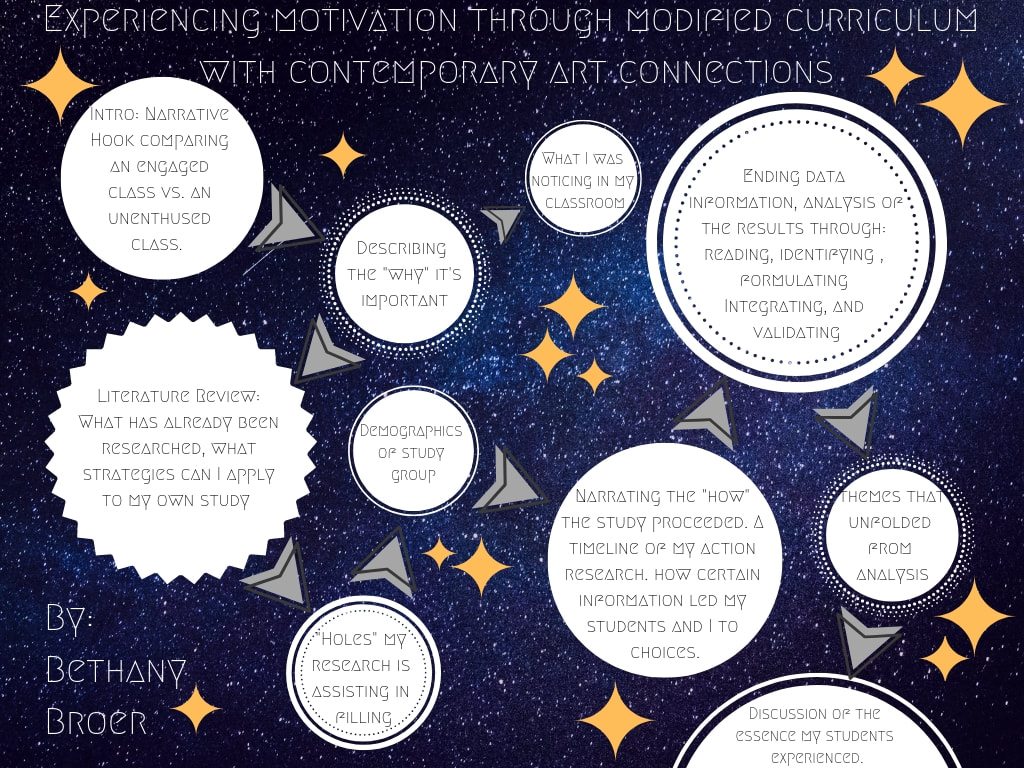
Broer, Experiencing Motivation Through Modified Curriculum with Contemporary Art Connections
Post #1 - Chosen Approach and Study Update
My chosen approach for writing up my research is Phenomenology. I decided this would be the best approach for my study because I am curious about my groups experience with the change in my curriculum. Even though students and I are making modifications to their learning, I want to know if this structure causes a difference in my study groups motivational essence, not just for one or a few individuals. Table 8.2 on pages 190 -1 in Creswell’s Qualitative Inquiry and Research Design is a great starting point in assessing what I have done and what still needs to be completed. Currently, my data organization is under way and I have began the creation and organization of my online files. I have also started to read through some of my data text and have been choosing what is important, what needs to be classified, and have started to form my initial themes. Once my study is completed, I believe I have a few weeks left till finished, I will have to start the task of rereading through students written information to describe their overall experience. I will have to work at writing out the textural description and represent the essence of the experience in tables, figures, artwork, and discussions.
This week students began to get their layered photos done and then reflect by using VoiceThread. I had a bit of fun last weekend and went through the process of creating an informational VoiceThread for students to know the reflection questions and also tips on how to create theirs in VoiceThread. One struggle we kept running into was that students had difficulty creating an account. The other major struggle was that students computers would not allow them to voice record and so quite a few had to write their reflections in the slides. Midterms are this upcoming week and it is my hopes that students will have their reflection, rubric, and another visual journal entry done.
This week students began to get their layered photos done and then reflect by using VoiceThread. I had a bit of fun last weekend and went through the process of creating an informational VoiceThread for students to know the reflection questions and also tips on how to create theirs in VoiceThread. One struggle we kept running into was that students had difficulty creating an account. The other major struggle was that students computers would not allow them to voice record and so quite a few had to write their reflections in the slides. Midterms are this upcoming week and it is my hopes that students will have their reflection, rubric, and another visual journal entry done.
